The Cruise industry’s COVID-19 crisis: how bad is it really?
Overview
At VesselsValue, our Trade platform allows us to measure demand for vessels through applying algorithms and analysis to satellite and terrestrial AIS vessel location data. This provides us with objective, real-time and historical data on Cruise ship activity, including stoppages, journeys and demand trends, at vessel, fleet and global level.
On the 3rd February 2020, an outbreak of COVID-19 was reported on the Diamond Princess Cruise ship which was situated just off the Japanese coast. Over the next month, over 700 people tested positive and sadly 9 died. The fate of the passengers and the response of the authorities was played out on the world media stage and subsequently it was unsurprising that Cruise operations were steadily halted across the world.
The world is still in this virtual standstill for Cruise operations which we can clearly see in the VesselsValue Trade data.
In the following analysis we compare a variety of AIS derived data to see the real effects of COVID-19 on Cruise vessel activity. We will be analysing journey counts, port calls, average speeds and passenger miles, comparing the last 7 months with the same period in 2019.
Port to Port Sailings
In 2019 there were 346 Cruise Ships operating on the water. During the first half of 2019 they made a total of circa 30,000 journeys and travelled a total distance of 13.5 million nautical miles.
For the same period in 2020 the number of Cruise ships operating on the water had increased by 10, giving a total fleet of 356. The total number of journeys were down by a staggering 53% to a total of 14,048. The reality may be even worse as most, if not all of these journeys where to off board passengers and reposition for layup.
This is a clear result of the “no sail order” enforced by the CLIA (Cruise Line International Association) and CDC (Centre of Disease Control) due the COVID-19 Pandemic. The recent announcement of the “no sail order” being extended until the end of September 2020 is taking further toll on the industry.
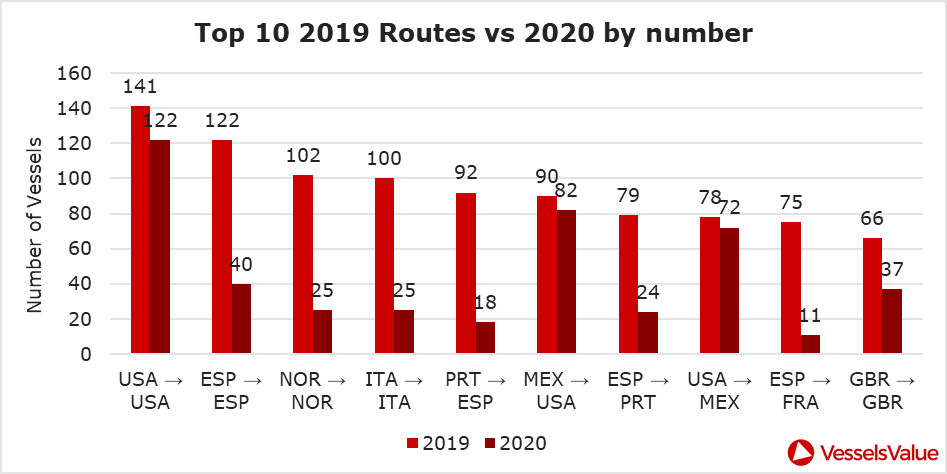
The top 10 port to port sailings by number of vessels for 2019 compared to 2020 is shown in figure 1.
Overall, sailings are down for 2020. The biggest decline can be seen on the route of Spain to France with a percentage drop of 85%.
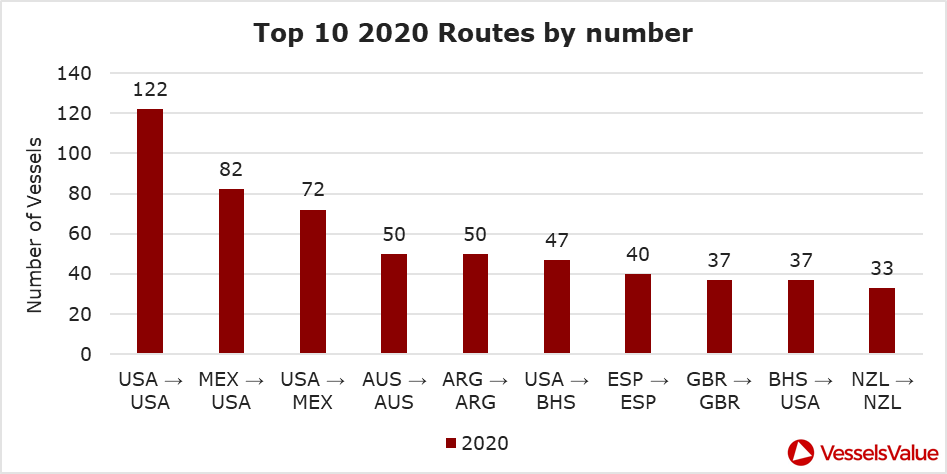
The top 10 port to port sailings of 2020 by number of vessels is shown in figure 2. A complete change to the top 10 sailings of 2019.
What should also be remembered when analysing Port to Port Sailings as indication of the strength of the market is that due to COVID-19 “no sail orders” many of, and latterly most of, these sailings will be Cruise lines repositioning their fleets for ‘lay up’. The estimated cost of warm layup is said to be USD 2-3 mil per vessel per month, meaning owners with large fleets of Cruise ships like Carnival are forking out close to a quarter of a billion dollars for just one month of layup.
Popular Ports
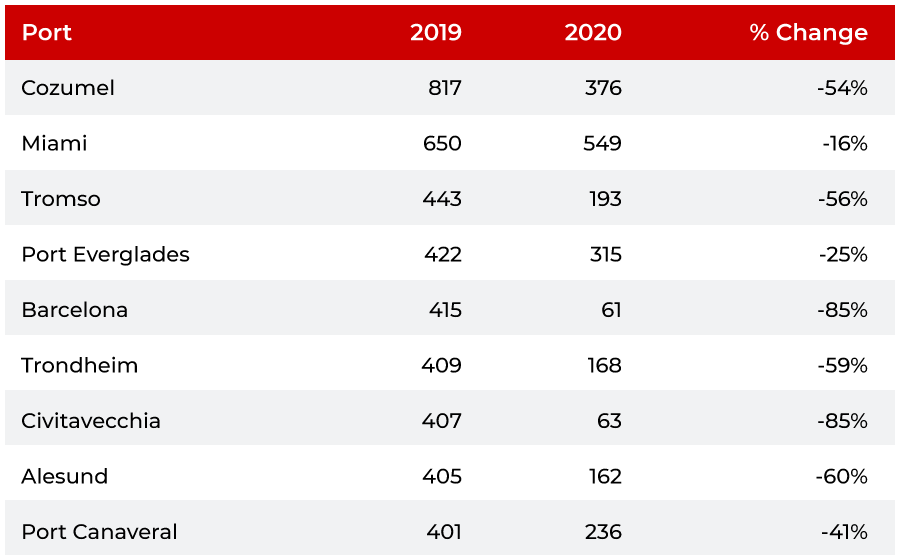
Figure 3 shows the top 10 most frequently visited ports for 2019 and compares the number of port calls to 2020.
All the Top 10 ports visited between January and July 2019 have taken a big hit this year as suspected.
Ports on the international Cruise routes such as Mediterranean holiday Ports like Barcelona have suffered the worst, seeing falls of circa 85%. Miami, the homeport for major Cruise lines has experienced the lowest drop off only 16%, which is likely a result of repositioning.
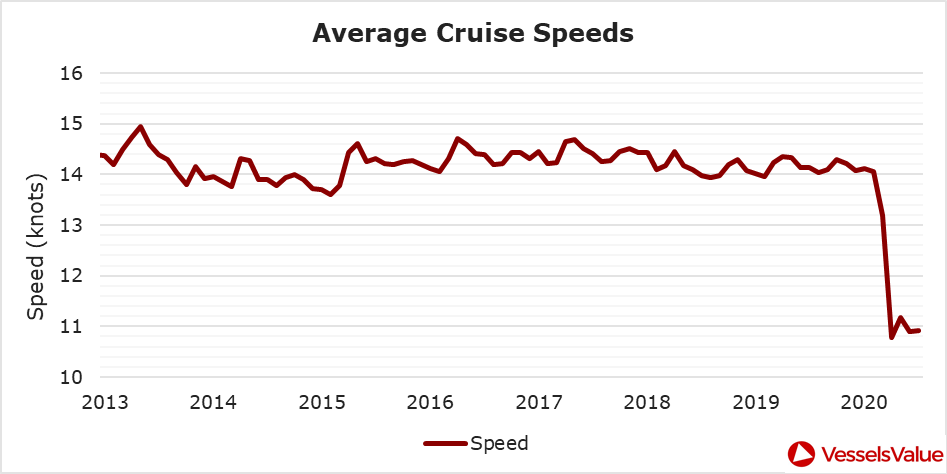
Speeds
Figure 4 below shows the average speed of Cruise Ships since 2013 from VesselsValue Trade data. The speed, particularly in recent years has remained very stable ranging between 13.5 knots and 15 knots. However, Cruise ship voyages are now becoming associated with non-profit laying up as opposed to genuine Cruise activity. Since the beginning of the year, average speeds have plummeted to 11 knots to save on fuel costs whilst the vessels are en route to their layup locations.
Activity
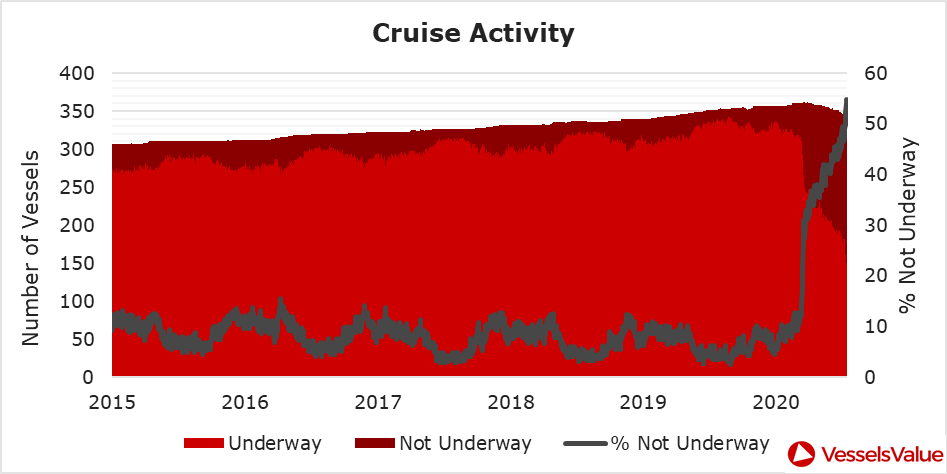
An additional way to show the effect COVID-19 has had on the industry is to analyse time spent underway versus time spent stationary. The only caution to this analysis would be that the positioning of Cruise ships for warm lay-up shows as ‘underway’.
Figure 5 shows the Cruise activity since 2013.
The constants leading up to the pandemic were positive, the consistent steady increase in global fleet size and the high utilisation which is shown by the low number of ‘vessels not underway’ data, seldom rising above 10%. However, as we have seen with the number of journeys and average speeds, activity follows suit by falling off the COVID cliff.
Currently 54% of the global fleet is not underway, the other 46% ‘Underway’ is most likely involved with repositioning for layup and yard visits.
Royal Caribbean Group
In this section we will investigate what VesselsValue trade data can reveal about COVID-19 effects on Cruise operations. Royal Caribbean as the second biggest Cruise operator will be used as a case study.
The Royal Caribbean Group is formed of 4 main Cruise lines and 1 joint venture:
- Azamara Cruises
- Celebrity Cruises
- Royal Caribbean International
- Silversea Cruises
- TUI Group (Joint Venture)
Collectively they have 51 live vessels and 13 on order, with a fleet value of 24.85 billion US dollars, down 18% since Jan 20.
Their current locations are shown below in figure 6.
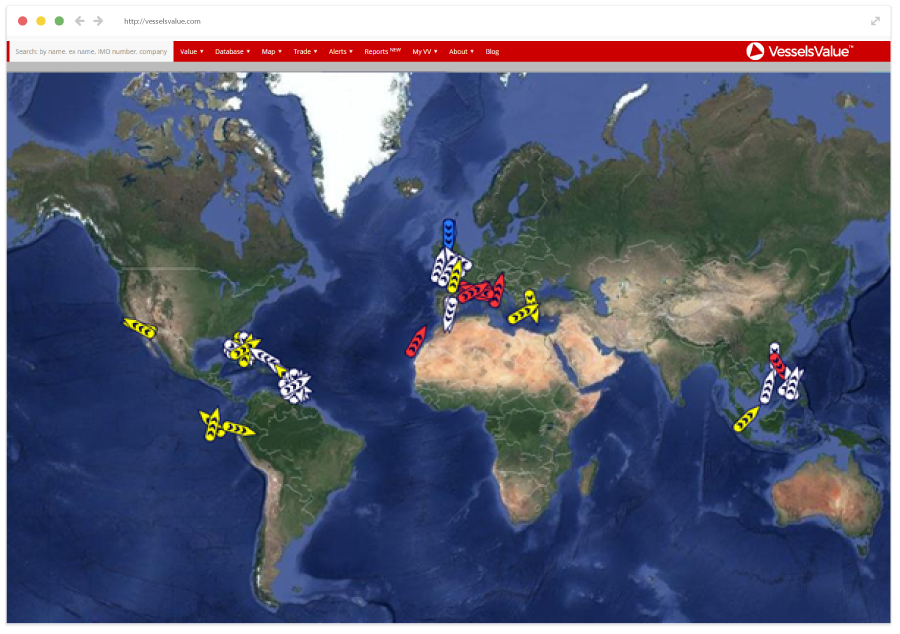
7 Cruise Ships are currently residing in Barbados and 10 off the coast of Miami. 30% are not underway and those that are underway have an average speed less than 10kts.
The RCL group made a total of 3,554 journeys between Jan 19 – Jul 19, for the same time period this year, only 1,606 journeys were made, a 54% decrease.
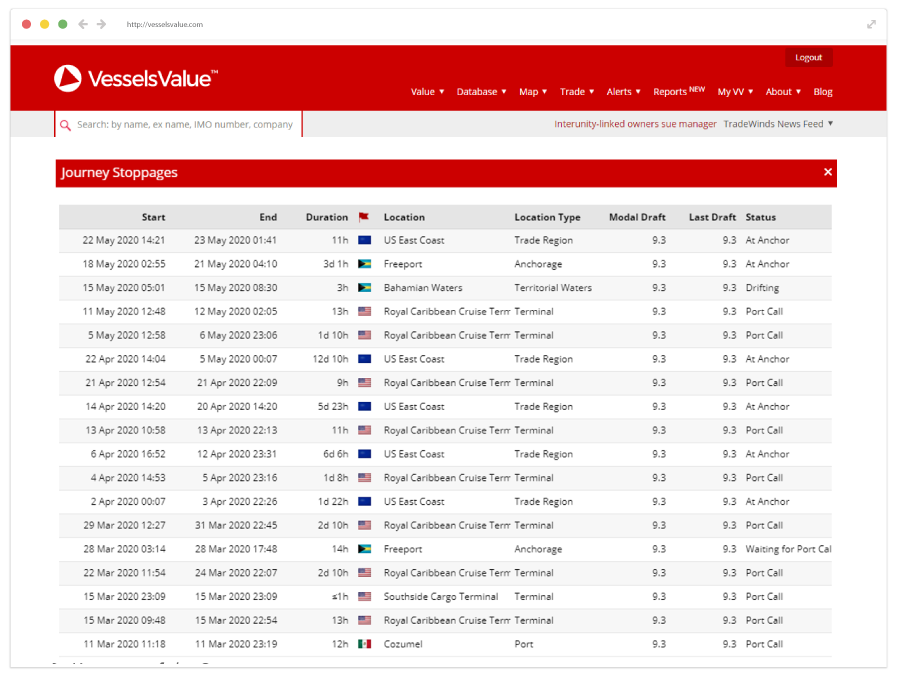
Using Trade journeys, we can look at their famous Mega Cruise ship, Harmony of the Seas, to analyse and track her activity and port calls. Trade also allows us to track estimated stoppage types such as vessels at anchor, in shipyards and drifting.
See figure 7 for a detailed view of a vessel’s activity.
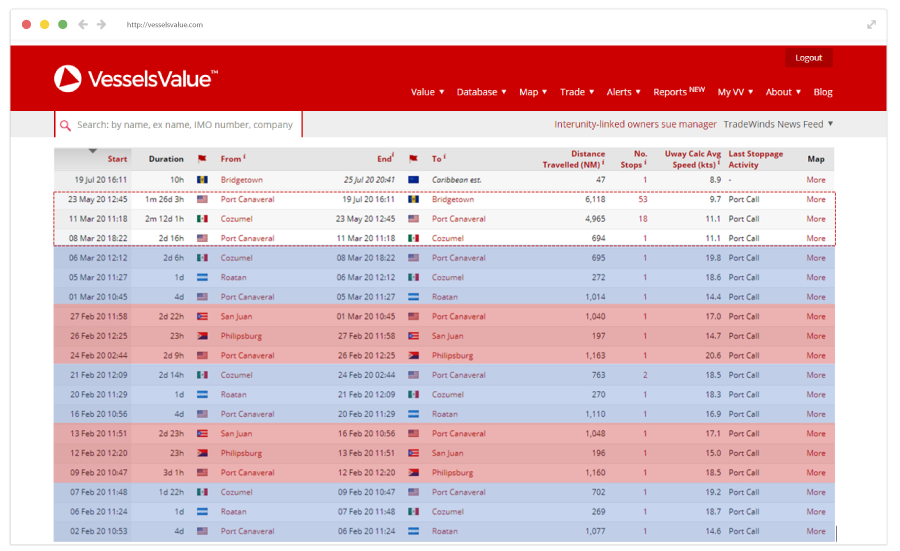
Up until the 8th March she was Cruising her typical routes at typical speeds. The routes highlighted in blue and red are carbon copies of the routes she was doing same time last year. However, her route drastically changes on the 11th March, two days before the CDC announce a voluntary “no sail order”.
She spent over 2 months traveling back to Cozumel, making 18 stoppages. Below in figure 8 is a breakdown of these stoppages. From the below breakdown, Harmony of the Seas spent 30 days at anchor on US east coast, whilst the rest of the time she was making port calls at Royal Caribbean Cruise Terminal, in Port Canaveral.
Harmony then went on a 1 month and 26-day trip to Bridgetown, Barbados, where she currently resides. No doubt eagerly awaiting a return to service.
The Supply & Demand Balance
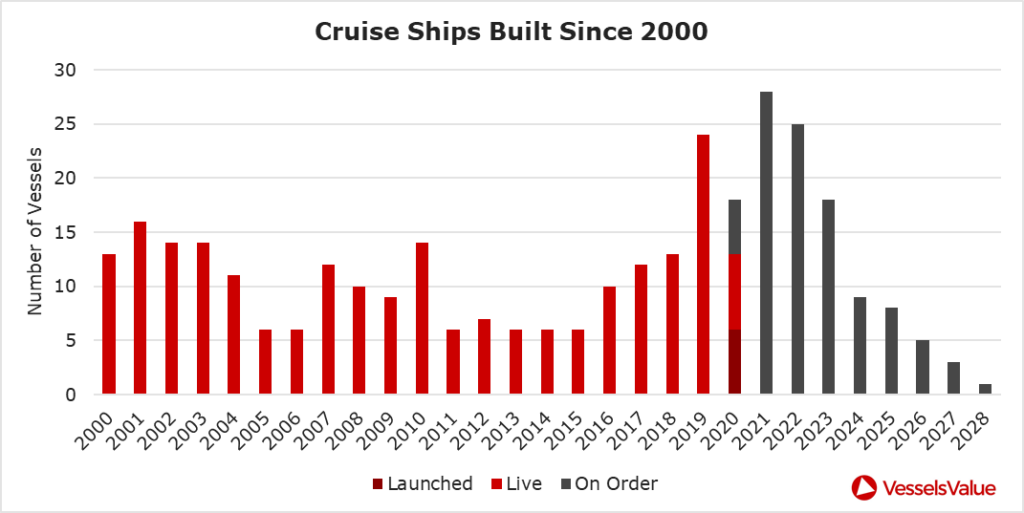
Since the financial crash in 2008 the Cruise Industry has been one of the most stable and prosperous maritime sectors. It has experienced huge fleet growth in recent years with a growth in demand to match. Figure 9 shows the number of Cruise Ships built and set to be built from 2000-2028.
2019 saw the largest number of vessels built in a single year to date increasing the global fleet by 5%. The current order books for 2021 and 2022 are both set to be higher than 2019 levels with 28 and 25 orders respectively.
With current global operations suspended, companies have begun announcing new-build delays. This will reduce the current predicted 15% growth between 2020-2022 helping to balance the supply with demand.
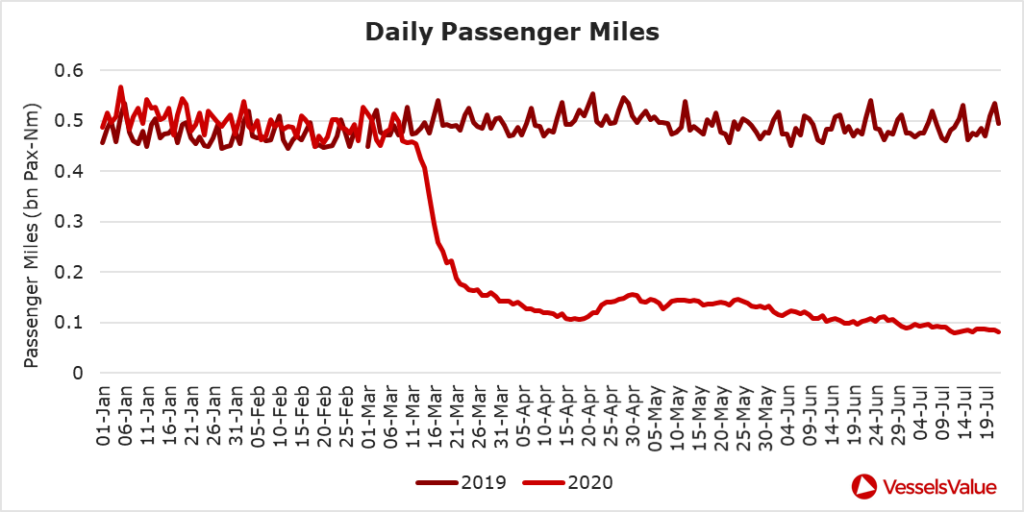
Figure 10 compares the passenger miles from 2019 to 2020. This graph significantly highlights the impact of the “no sail order” and layups have had on the industry. In 2019 the passenger miles remained at stable levels of circa 500 million Pax-Nm. March 2020 saw the figure plunge towards 100 million Pax-Nm, where it has settled through to July as vessels continue their non-profit repositioning.
There are indications that the required adjustments to match supply with demand are already materialising. Newbuild delays are slowing the fleet growth and only four newbuild orders have been placed this year.
Passenger ticket bookings are already showing a strong demand so there is every possibility that there will be a return to near 2019 levels.
Cruise Values
The global Cruise fleet has fallen in value by 33.4 billion USD Since Jan 20.
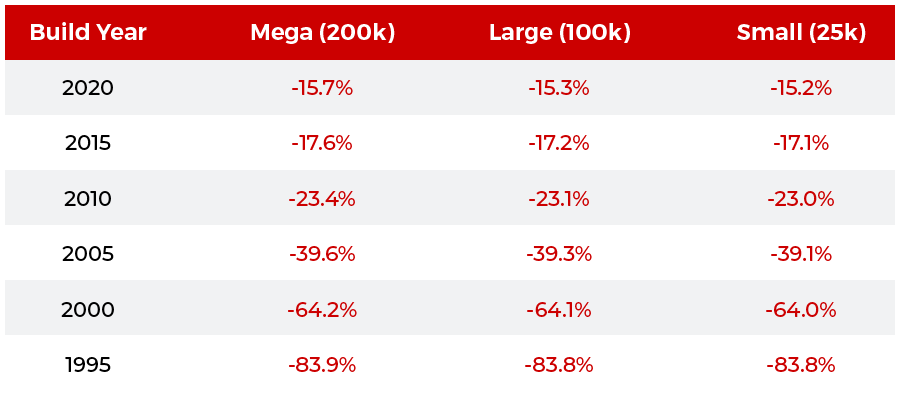
Figure 11 shows the percentage change in Cruise Ship values from to January to July. Cruise ships across all sizes and ages have experienced a large fall in value. Vessels built in 2000 and before having seen at least half their value evaporate.
A Cruise ship companies woes are therefore threefold:
- Profit making activity severely curtailed.
- Warm and cold lay-up costs high and ongoing.
- Value of their assets falling.
With the continued extensions on the Cruising bans, companies have begun selling off their older tonnage at rock bottom prices, crashing values for the older vessels.
A key example of this is Maasdam (55,575 GT, Oct 1993, Fincantieri Monfalcone).
At the end of 2019 she had an asking price of USD 120 mil, VV value USD 116 mil. The asking price fell several times, Feb USD 80 mil, Mar USD 40 mil, June USD 20 mil and the last know asking price before being sold was USD 10 mil. Her VV value today is USD 14.91, this a staggering 87% decrease in value since March.
Some Cruise Lines have opted to simply scrap. Pullmantur Cruises sold its fleet for scrap in Turkey at a very low 150$/LDT. Carnival also scrapped two of its Large Cruise Ships, blt 1996 and 1990. See figure 12.

In the current market moulded by COVID-19 owners are simply looking to offload their older, inefficient tonnage as quickly as possible, to save on the layup costs. These distressed sales are expected to continue for the foreseeable future.
Summary
VesselsValue data is clearly depicting stormy seas for the Cruise fleets worldwide whilst the pandemic holds sway. Commercial operations are a fraction of their previous levels and are likely to decrease further in August and September as the “no sail orders” remain in place and the full pandemic effects reach the Americas. Demand for cruises has declined to virtually nothing, with vessel activity since the COVID-19 related restrictions being for off boarding of passengers and repositioning of vessels for layup.
The VesselsValue Activity data shows over half ‘not underway’ and both Port to Port and Average Cruise Speeds would suggest most of the ‘underway’ traffic is non-profit and either costly lay-up or yard visits. This has resulted in a long-sustained period of low activity, negatively affecting market fundamentals and vessel values.
Cruise companies are fighting to stay afloat, some are even giving up completely and scrapping their entire fleet whilst others are selling off older vessels at knock down prices causing values to crash. The tendency so far has been to sell off older non-core assets, predominately 20 years or older and delay current new builds. This is clearly an effort to streamline and modernise current fleets for an eventual recovery. In this way supply has been adjusted to try and match the anticipated future demand.
Next year’s passenger bookings are reported to be positive, however there is still huge uncertainty if and when demand will recover to match the current excess supply of vessels. Therefore, we will continue to monitor the real time trade data to identify the demand recovery if and when it happens.
Disclaimer: The purpose of this blog is to provide general information and not to provide advice or guidance in relation to particular circumstances. Readers should not make decisions in reliance on any statement or opinion contained in this blog.
Want to know more about how our
data can help you assess the market?
Comments
Leave a Comment